pacman::p_load(tidyverse)Hands-on Exercise 1
Getting Started
Install and launching R packages
The code chunk below uses p_load() of pacman package to check if tidyverse packages are installed in the computer. If they are, then they will be launched into R.
exam_data <- read.csv("data/Exam_data.csv")summary(exam_data) ID CLASS GENDER RACE
Length:322 Length:322 Length:322 Length:322
Class :character Class :character Class :character Class :character
Mode :character Mode :character Mode :character Mode :character
ENGLISH MATHS SCIENCE
Min. :21.00 Min. : 9.00 Min. :15.00
1st Qu.:59.00 1st Qu.:58.00 1st Qu.:49.25
Median :70.00 Median :74.00 Median :65.00
Mean :67.18 Mean :69.33 Mean :61.16
3rd Qu.:78.00 3rd Qu.:85.00 3rd Qu.:74.75
Max. :96.00 Max. :99.00 Max. :96.00 Plotting a simple bar chart
Using GGplot2 (Histogram)
ggplot(data=exam_data, aes(x = MATHS)) +
  geom_histogram(bins = 10,
                 boundary = 100,
                 color = "black",
                 fill= "grey") +
  ggtitle("Distribution of Maths Scores")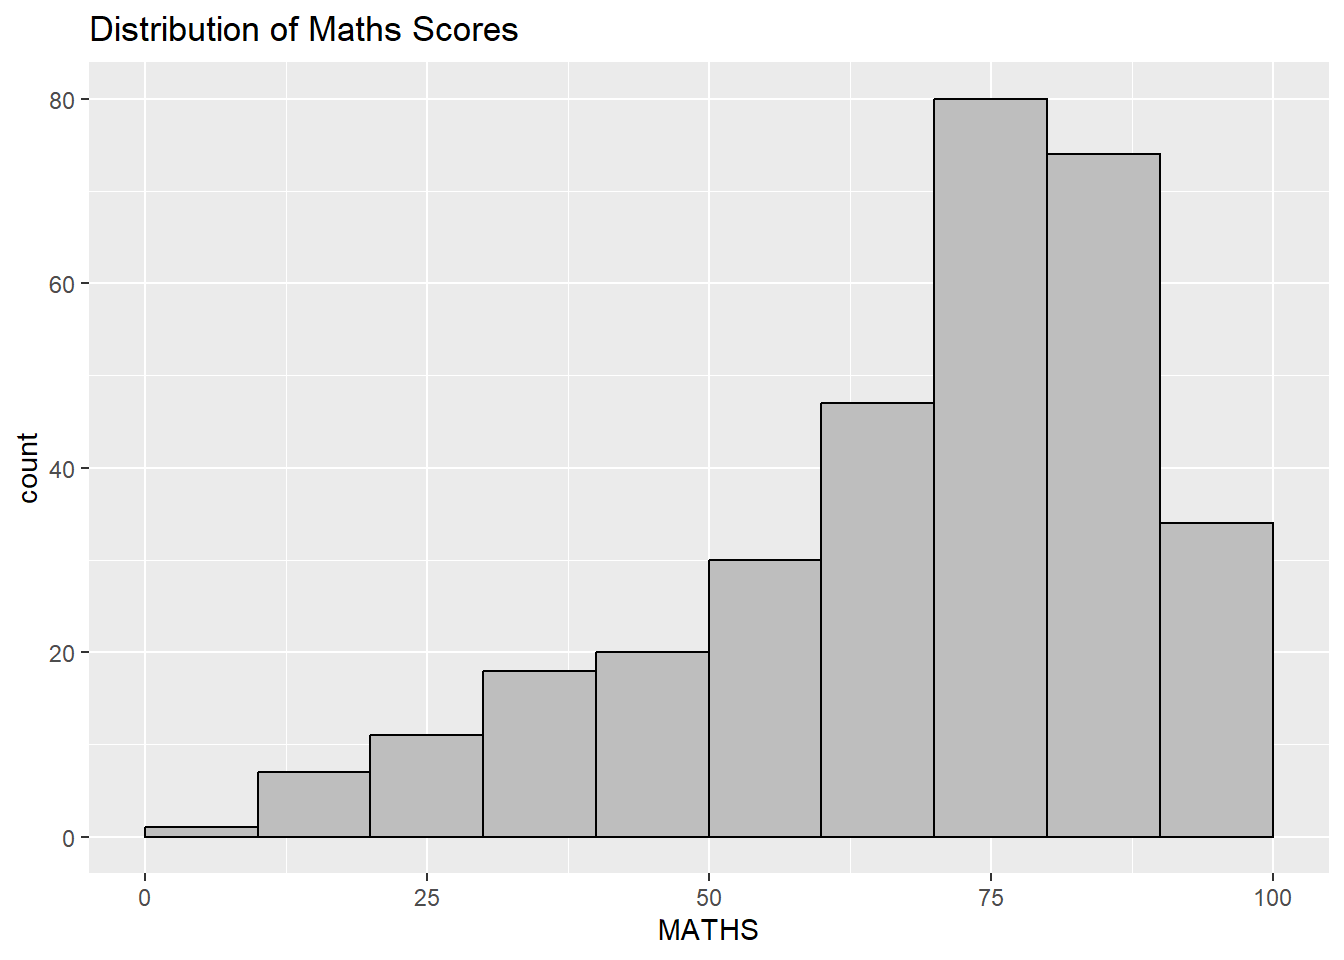
Using GGplot2 (Dotplot)
ggplot(data=exam_data,
       aes(x= MATHS)) +
  geom_dotplot(binwidth = 2.5,
               dotsize = 0.5) +
  scale_y_continuous(NULL,
                     breaks=NULL)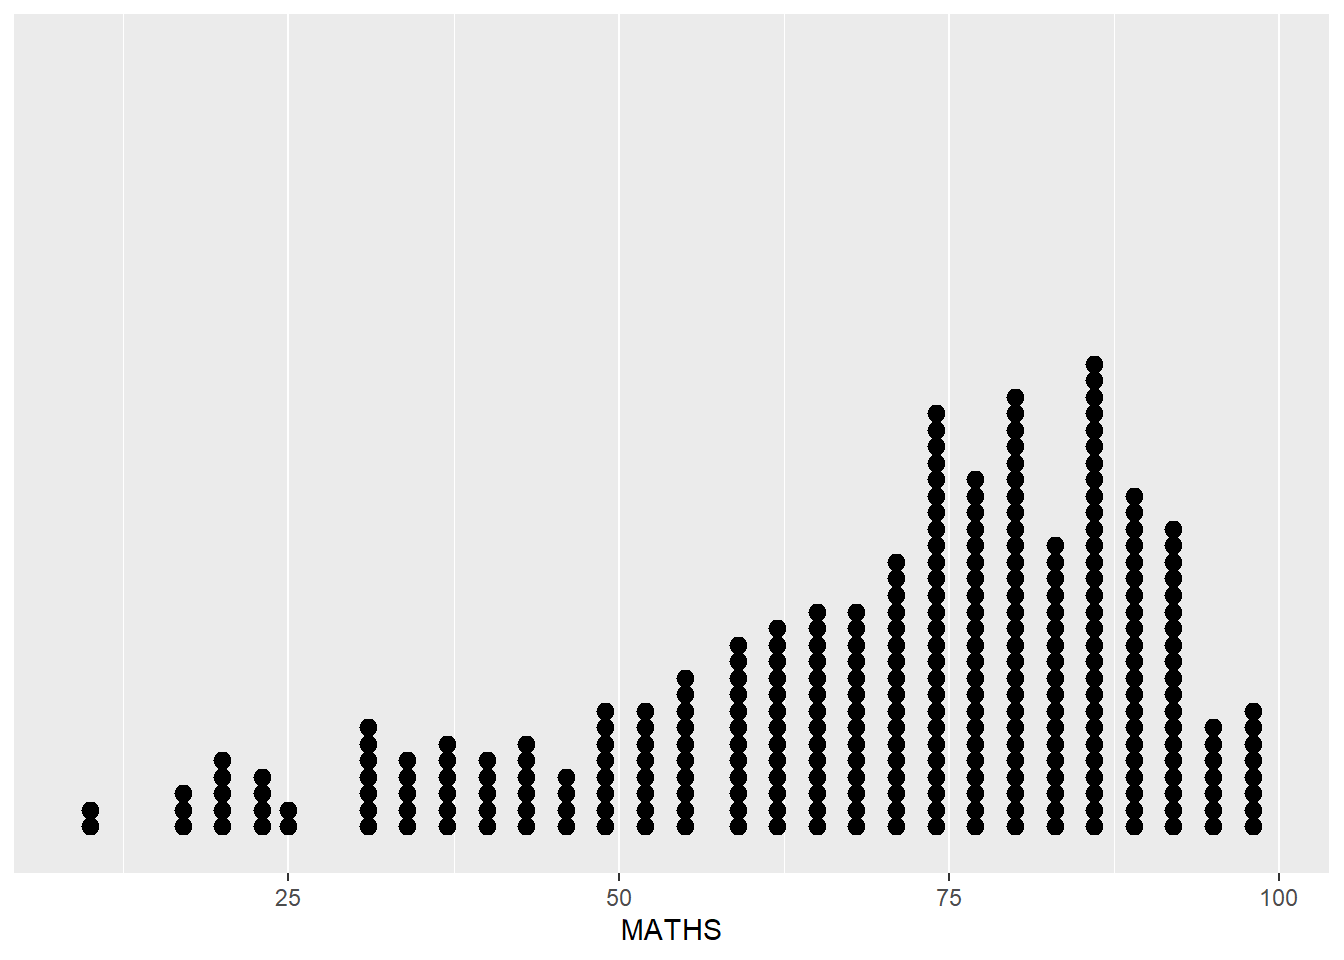
Modifying A Geometric Object by Changing aes()
ggplot(data = exam_data,
        aes(x = MATHS,
            fill= GENDER)) +
  geom_histogram(bins = 20,
                 color = "grey30")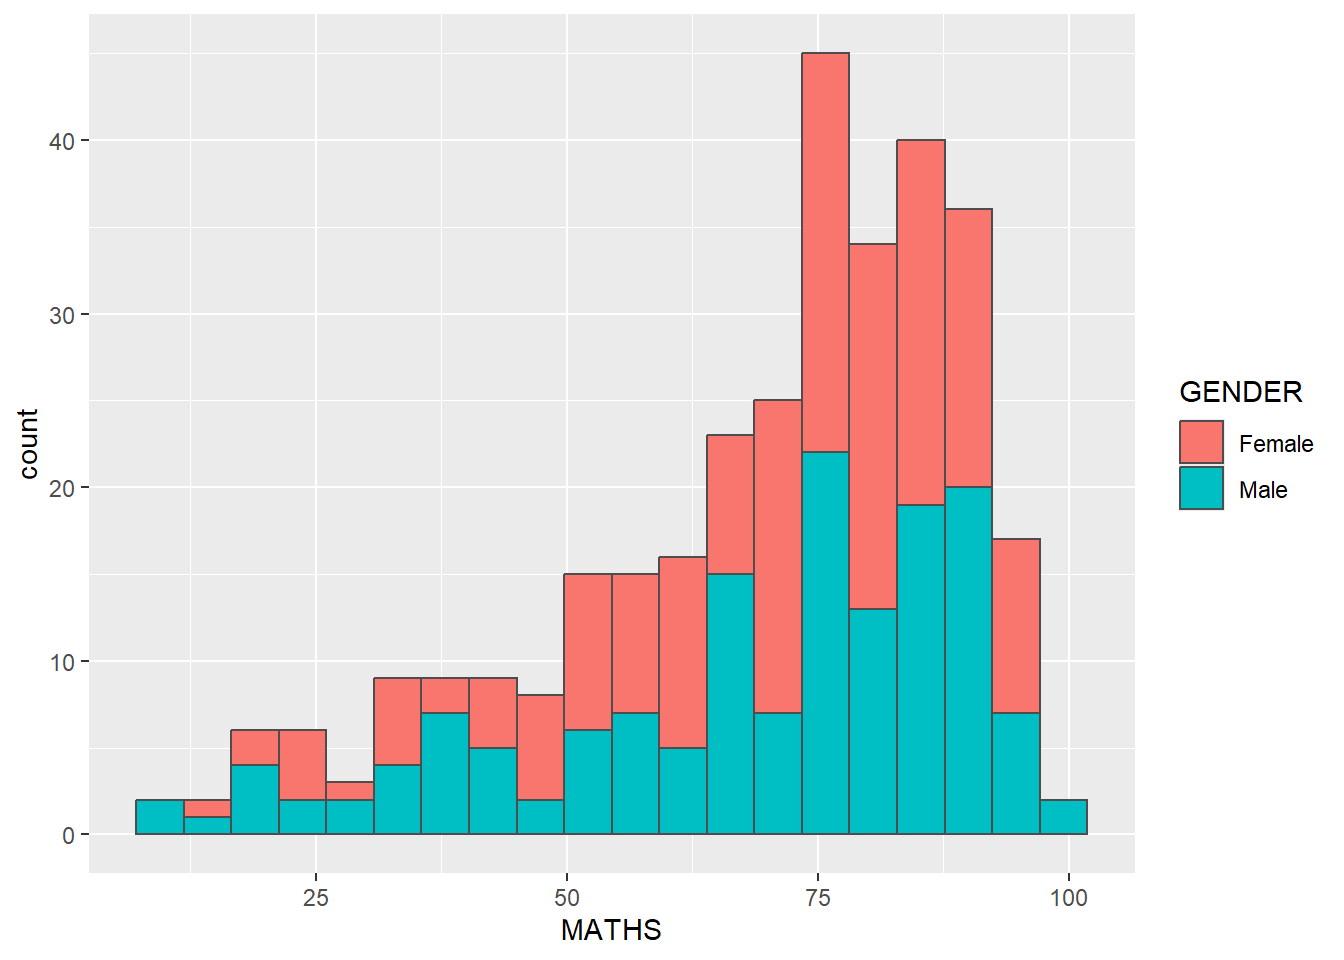
Geometric Objects: geom-density()
ggplot(data=exam_data,
        aes(x = MATHS,
            colour = GENDER)) +
  geom_density()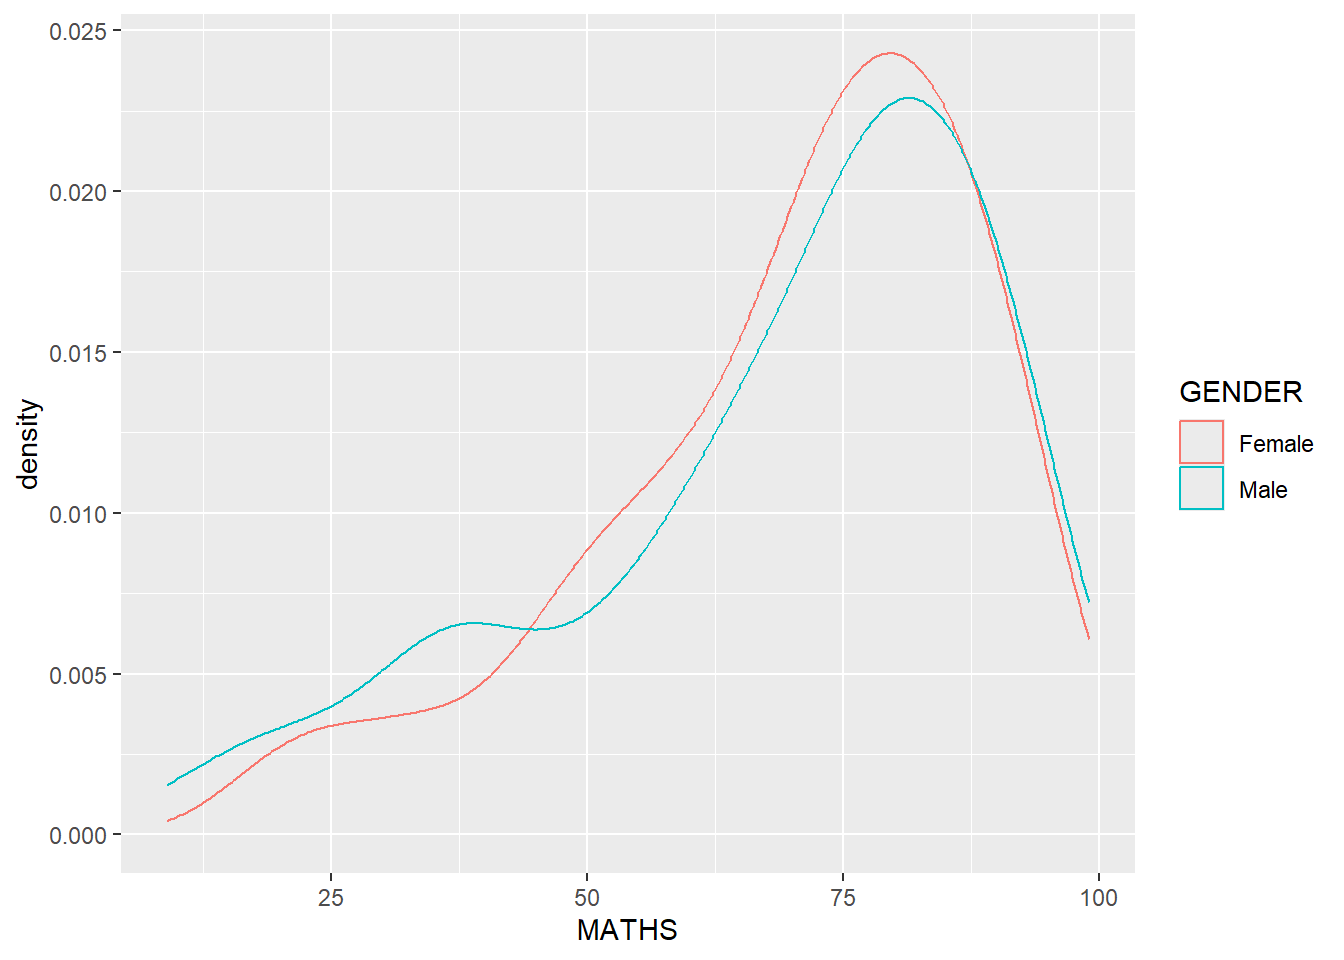
Geometric Objects: geom_boxplot
ggplot(data=exam_data,
        aes( y = MATHS,
             x = GENDER)) +
  geom_boxplot(notches=TRUE)
Warning in geom_boxplot(notches = TRUE): Ignoring unknown parameters: `notches`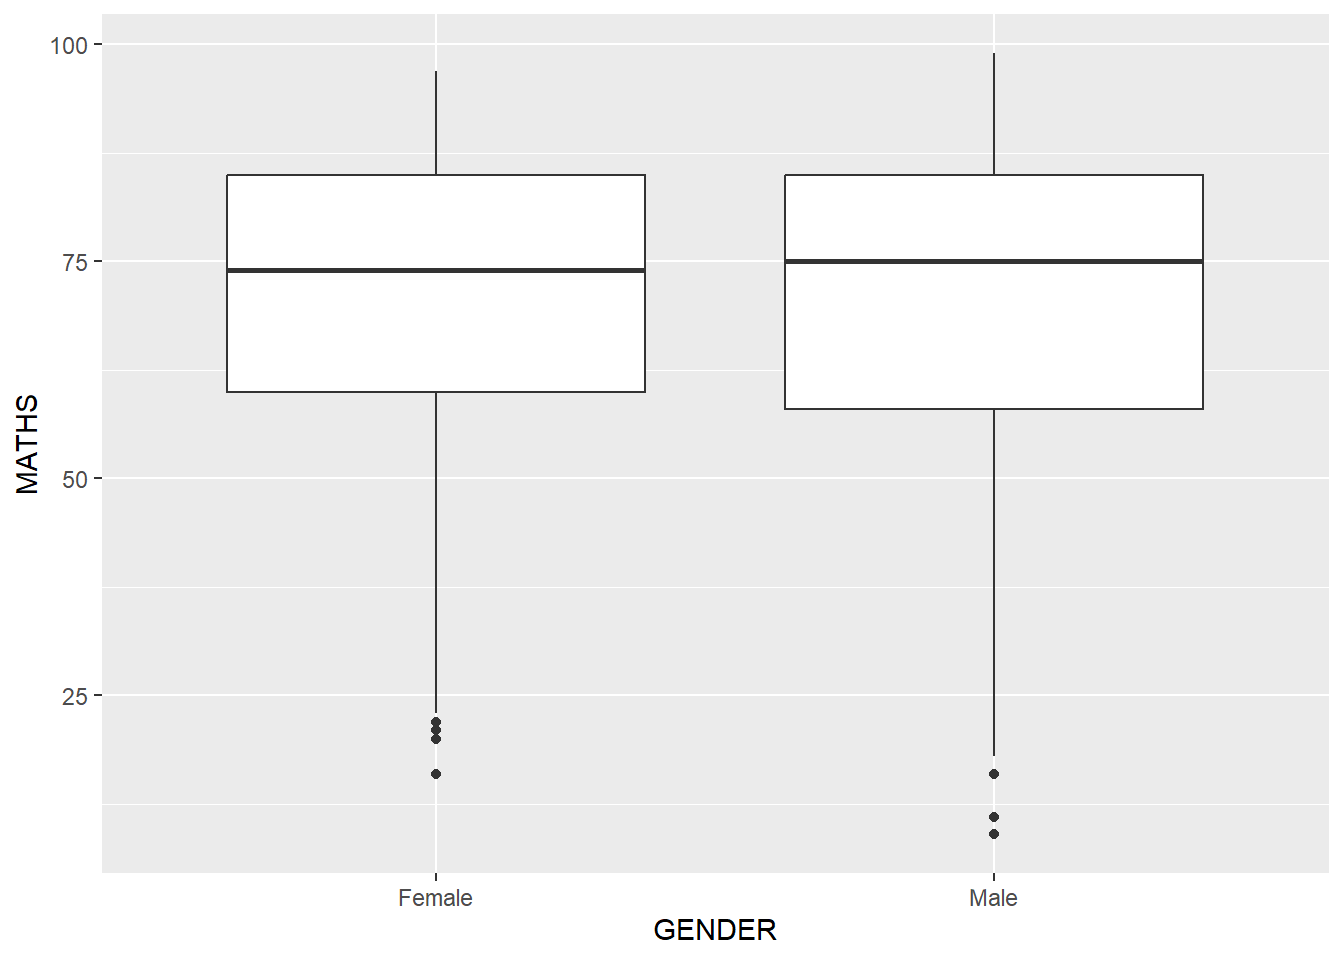
Geometric Objects: geom_violin
ggplot(data=exam_data,
        aes(y= MATHS,
            x= GENDER)) +
  geom_violin()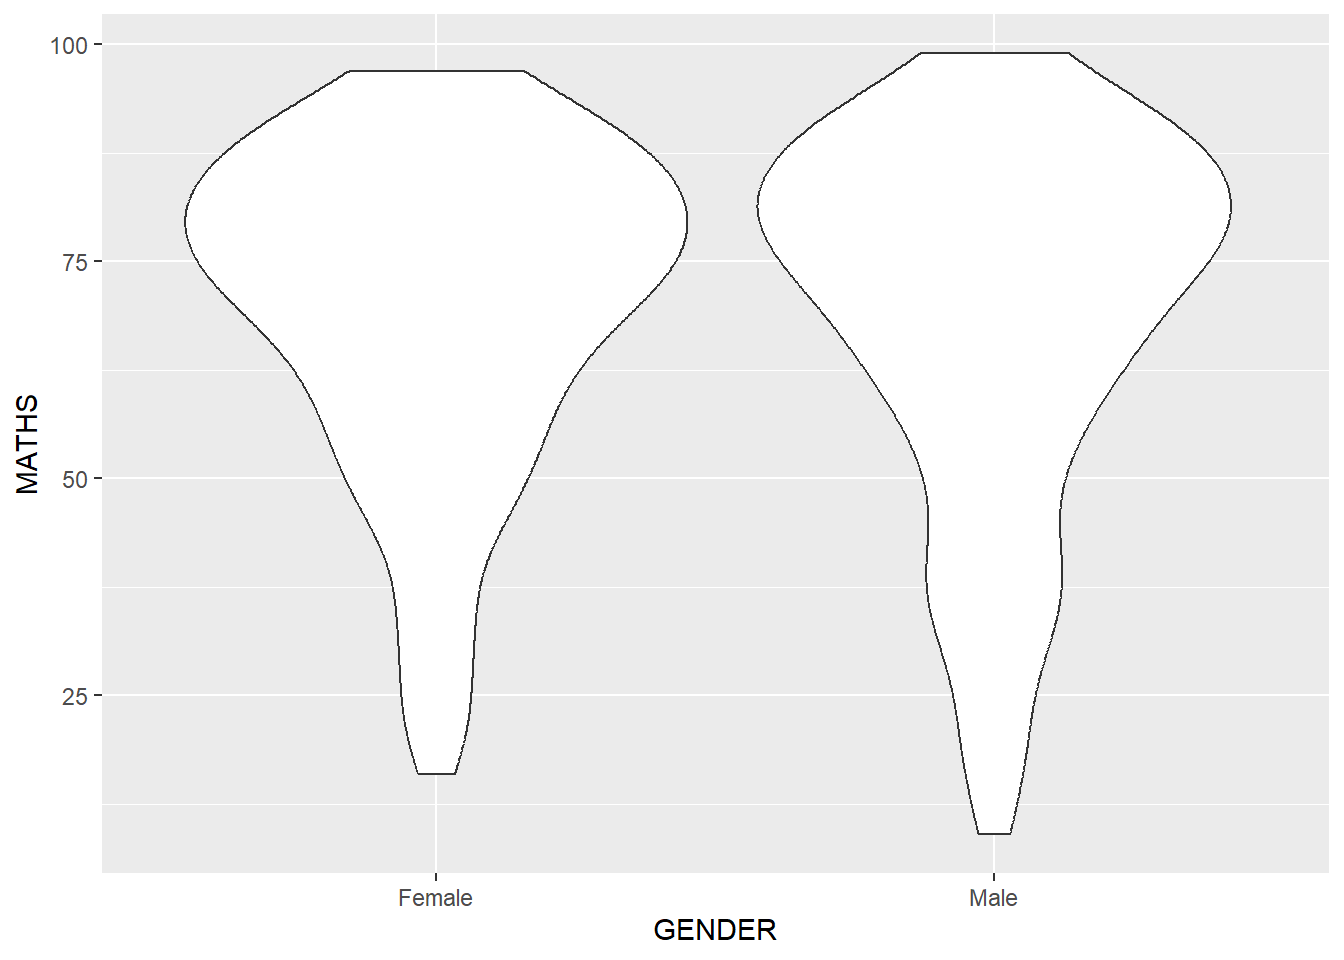
Geometric Objects: geom_point()
ggplot(data=exam_data,
        aes(x= MATHS,
            y= ENGLISH)) +
  geom_point()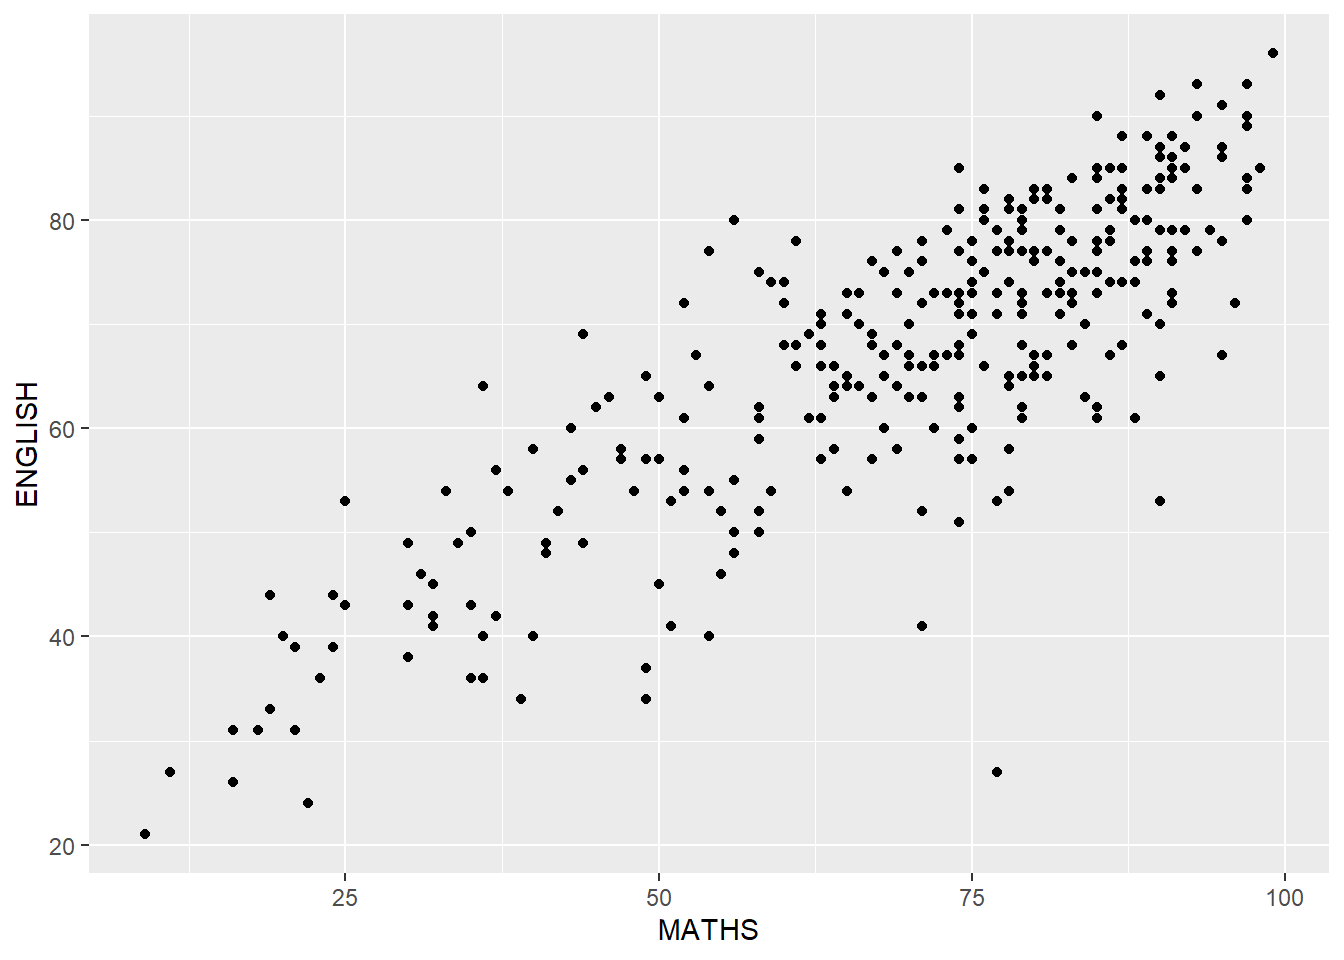
Combining geom Objects
ggplot(data=exam_data,
        aes(y=MATHS,
            x=ENGLISH)) +
  geom_boxplot () +
  geom_point(position="jitter",
             size = 0.5)
Warning: Continuous x aesthetic
ℹ did you forget `aes(group = ...)`?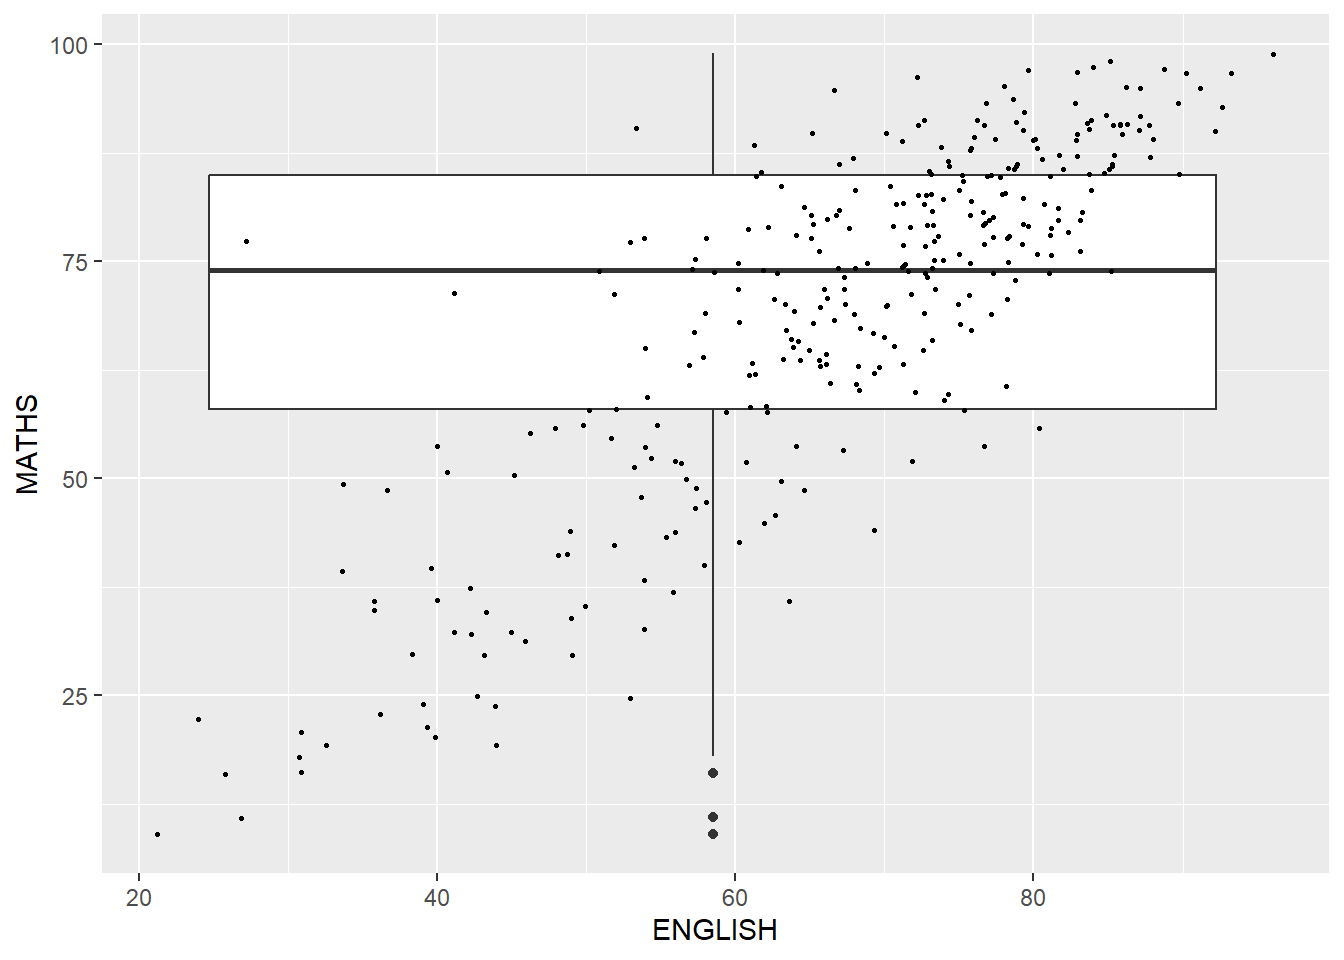
Adding Essential Grammatical Elements in ggplot2: stat
ggplot(data=exam_data,
       aes (y = MATHS, x = GENDER)) +
  geom_boxplot() +
  stat_summary(geom="point",
               fun.y="mean",
               color = "red",
               size=4)
Warning: The `fun.y` argument of `stat_summary()` is deprecated as of ggplot2 3.3.0.
ℹ Please use the `fun` argument instead.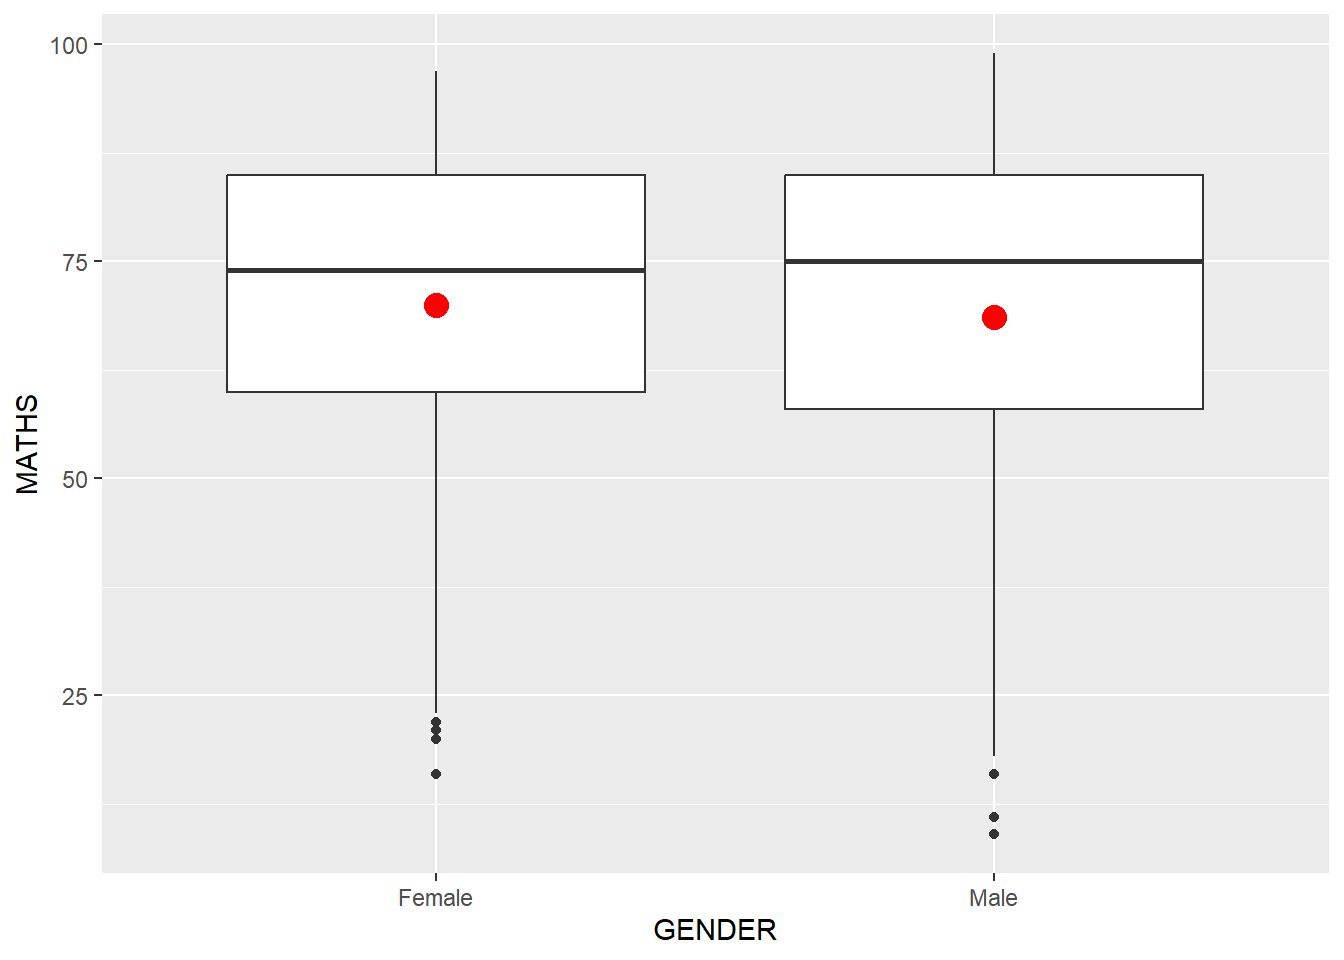
Adding a Best Fit Curve on a Scatterplot
ggplot(data=exam_data,
       aes(x=MATHS,y=ENGLISH)) +
  geom_point()+
  geom_smooth(method=lm,
              size=0.5)
Warning: Using `size` aesthetic for lines was deprecated in ggplot2 3.4.0.
ℹ Please use `linewidth` instead.`geom_smooth()` using formula = 'y ~ x'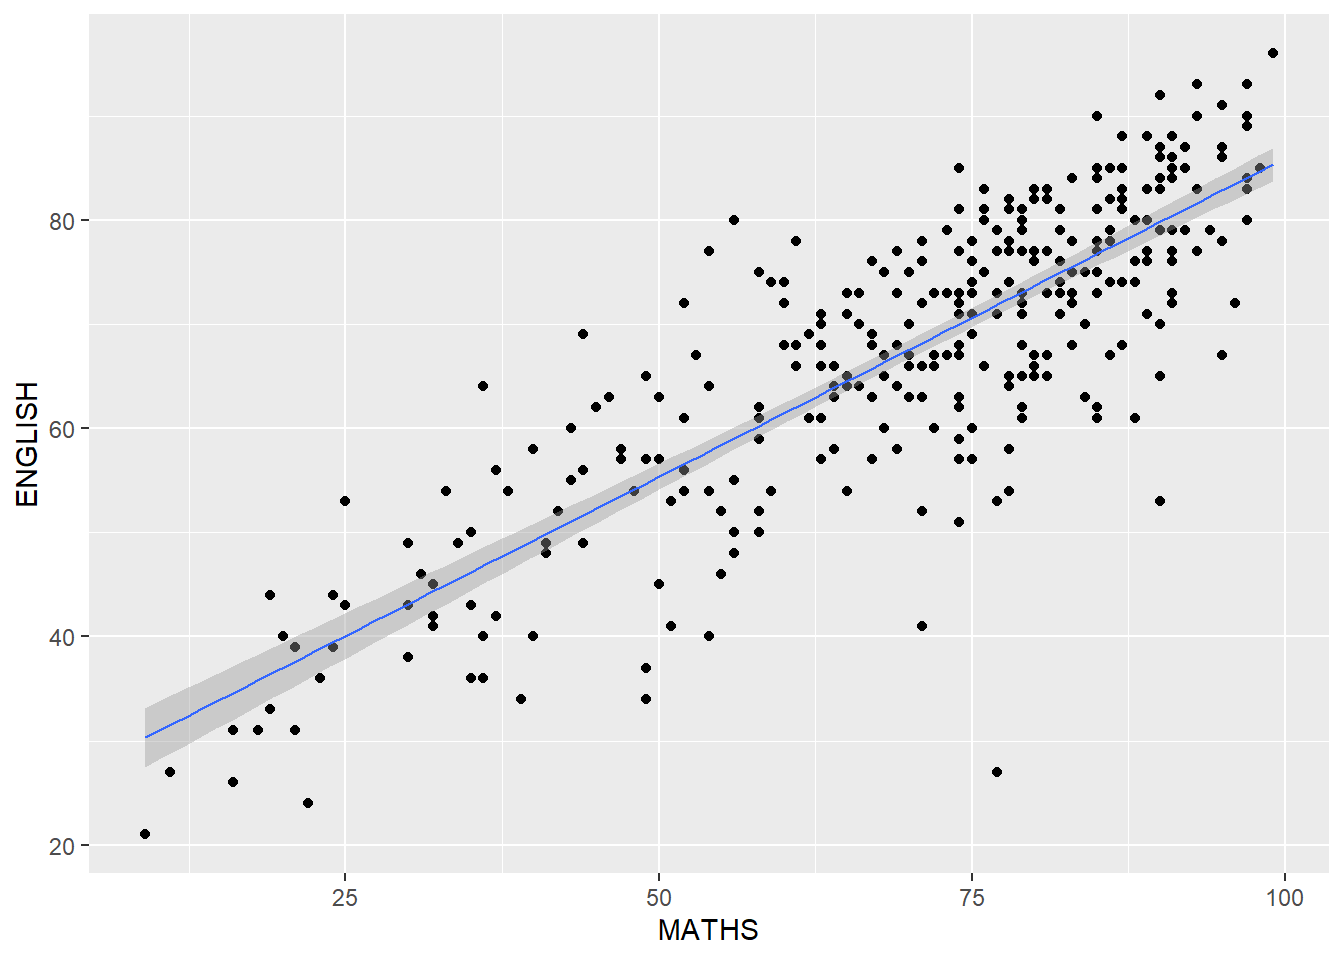
Adding Essential Grammatical Elements in ggplot2: Facets
ggplot(data=exam_data,
       aes(x=MATHS)) +
  geom_histogram(bins=20) +
    facet_wrap (~CLASS)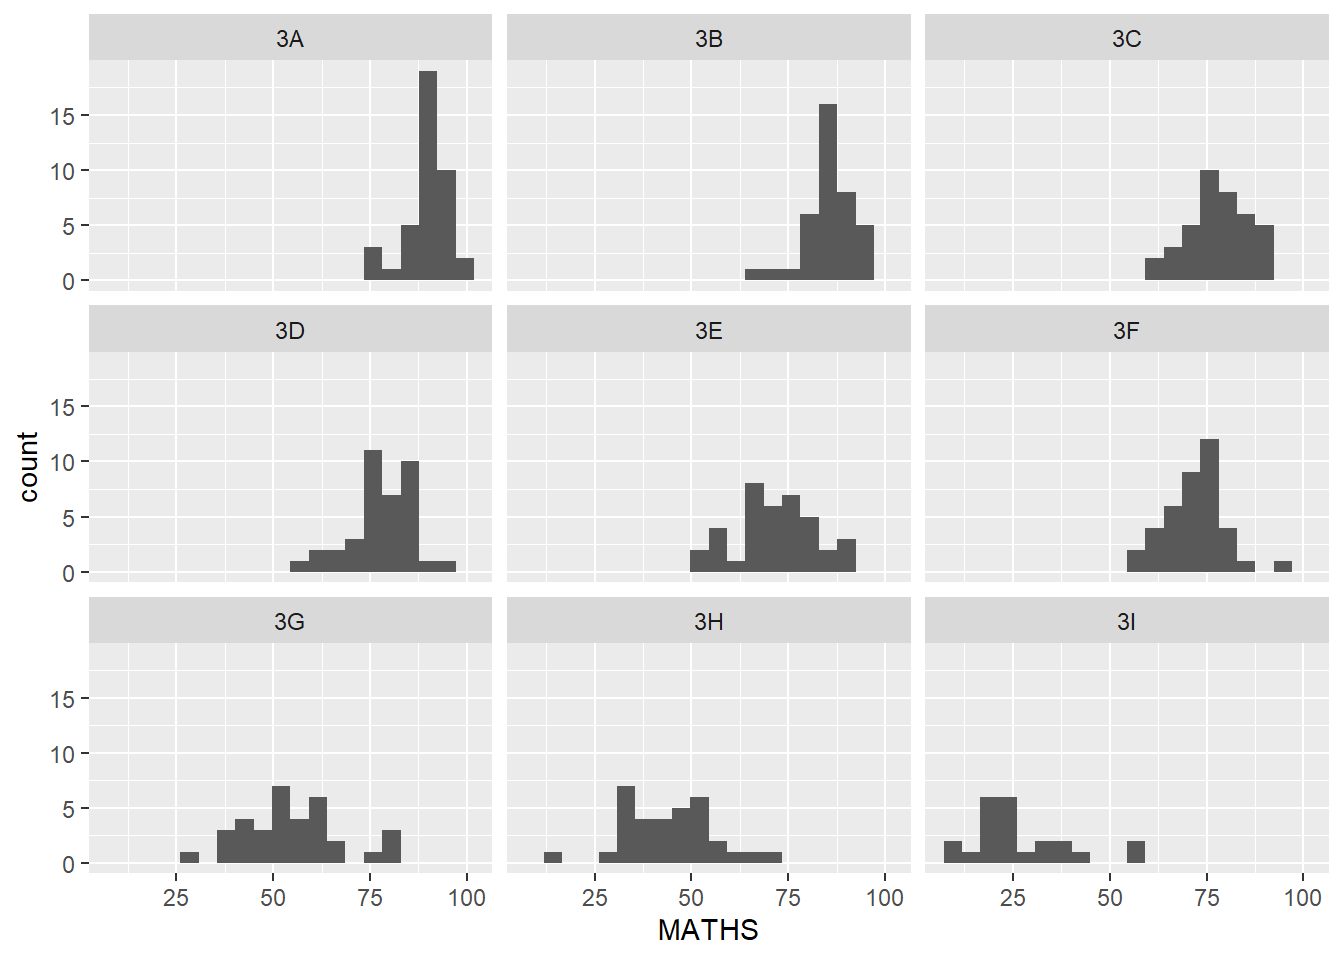
ggplot(data=exam_data,
       aes(x=MATHS)) +
  geom_histogram(bins=20) +
    facet_grid (~CLASS)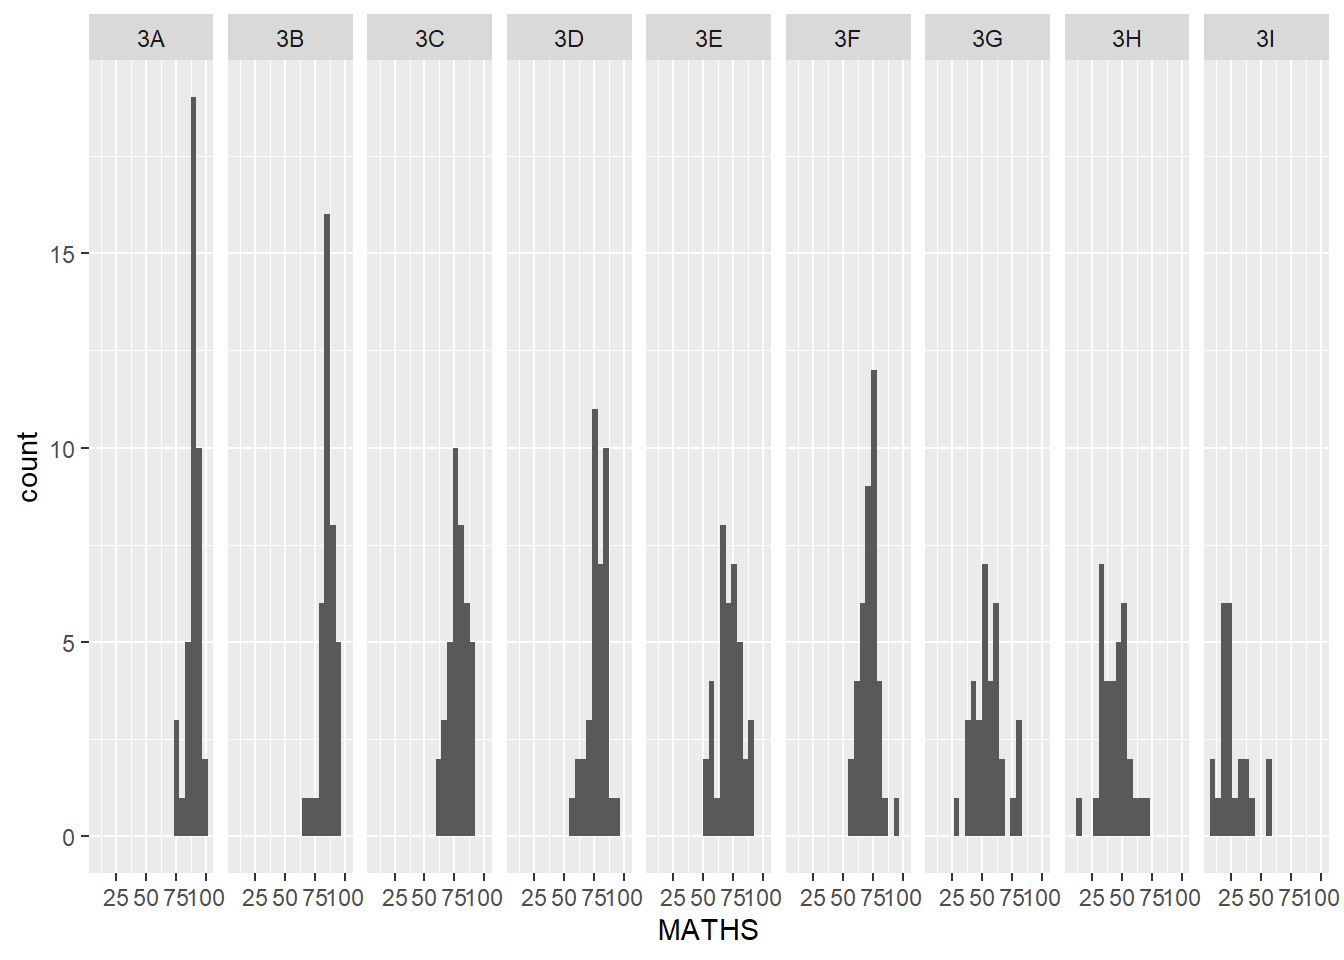
Essential Grammatical Elements in ggplot2: Coordinates
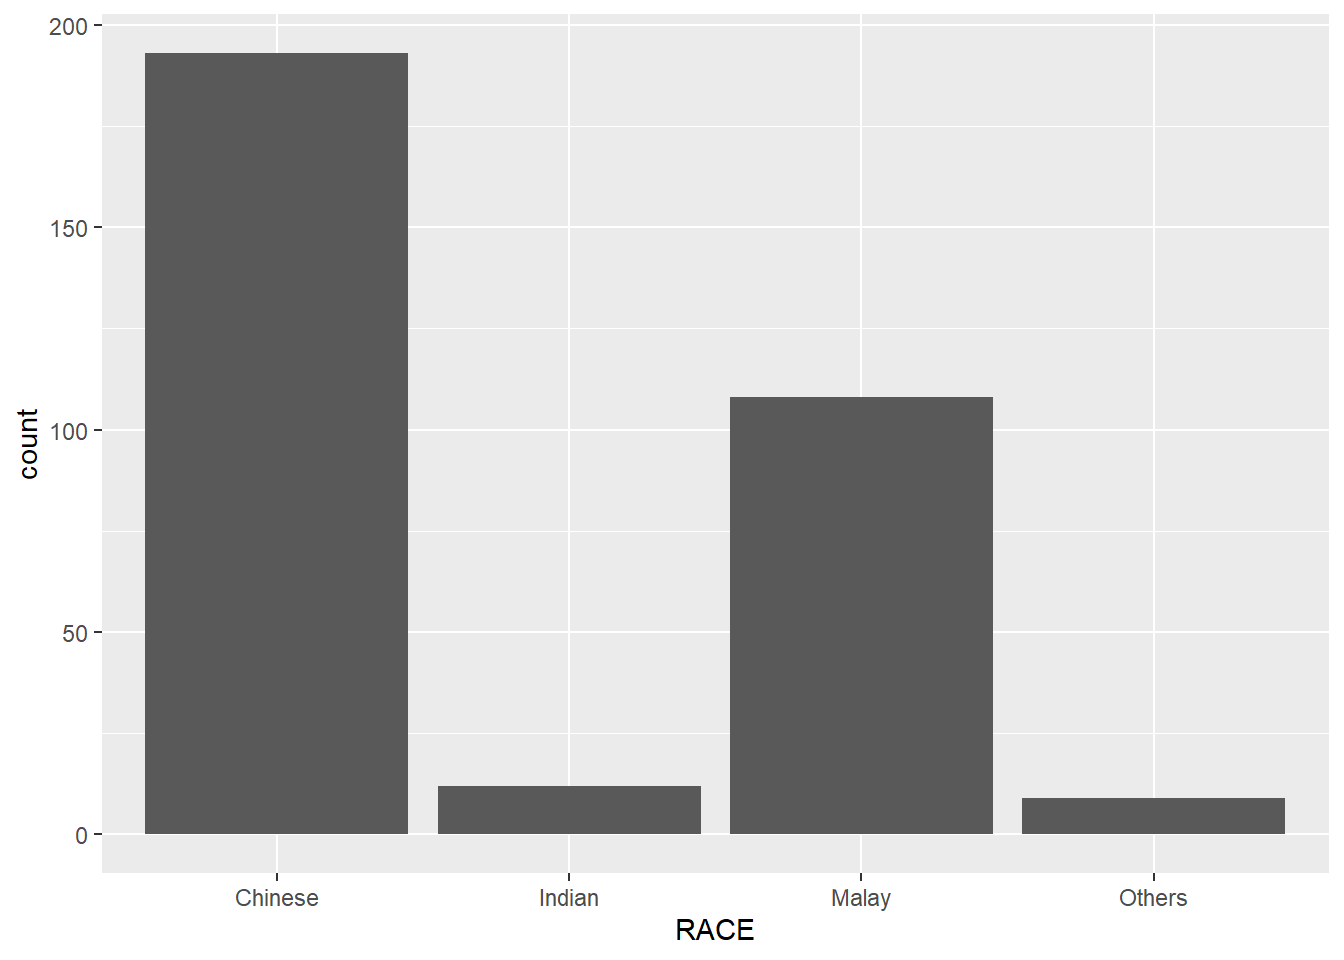
ggplot(data=exam_data,
       aes(x=RACE)) +
  geom_bar() +
  coord_flip()
Changing the y- and x-axis Range
ggplot(data=exam_data,
       aes(x=MATHS, y=ENGLISH))+
  geom_point() +
  geom_smooth(method=lm, size= 0.5)+
  coord_cartesian(xlim=c(0,100),
                  ylim=c(0,100))
`geom_smooth()` using formula = 'y ~ x'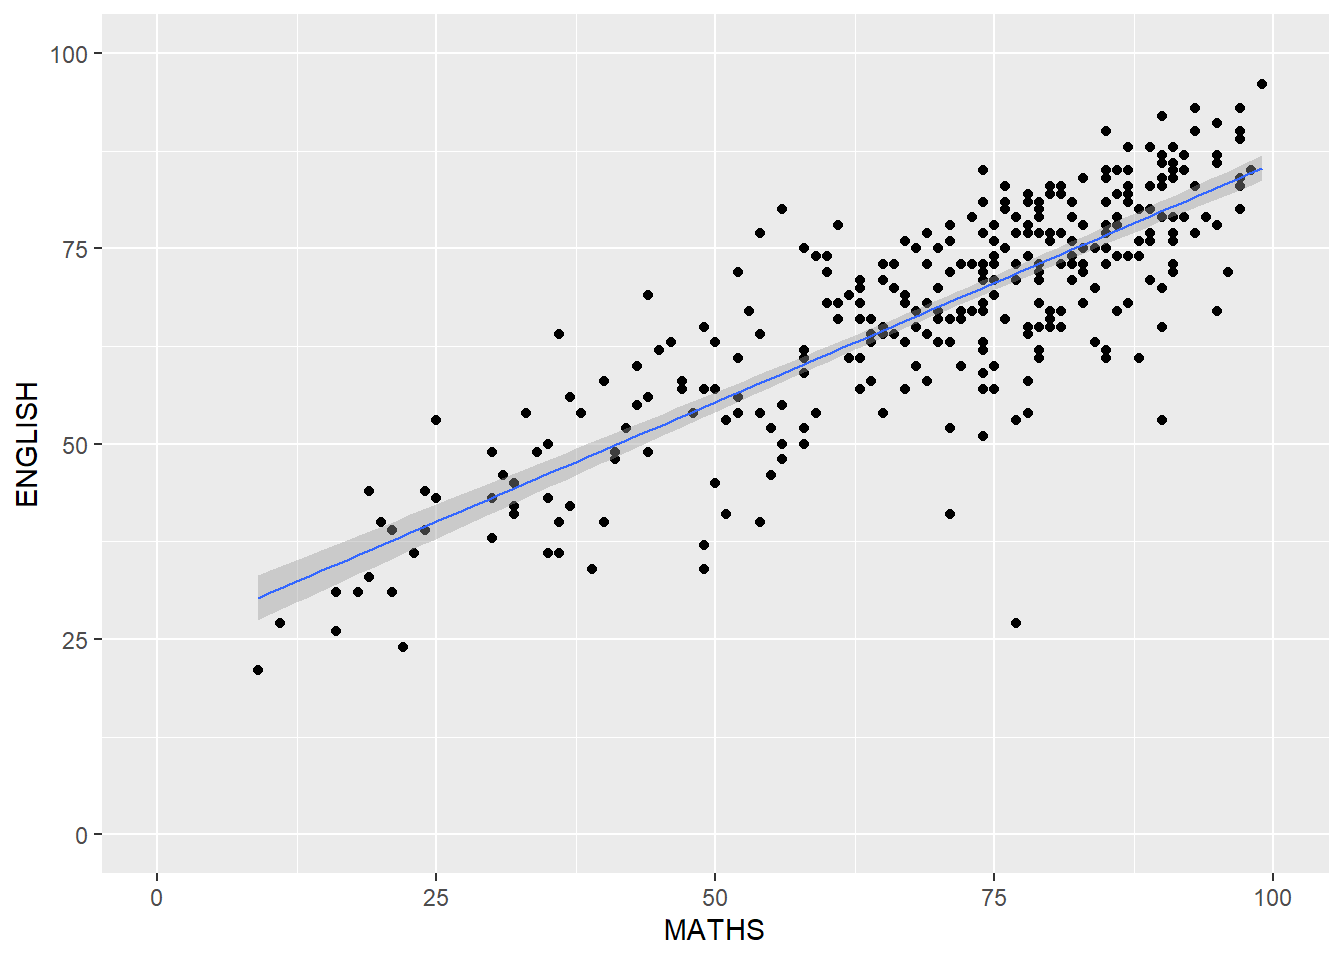
Essential Grammatical Elements in ggplot2: Themes
Gray Theme
ggplot(data=exam_data,
       aes(x=RACE)) +
  geom_bar() +
  coord_flip() +
  theme_gray()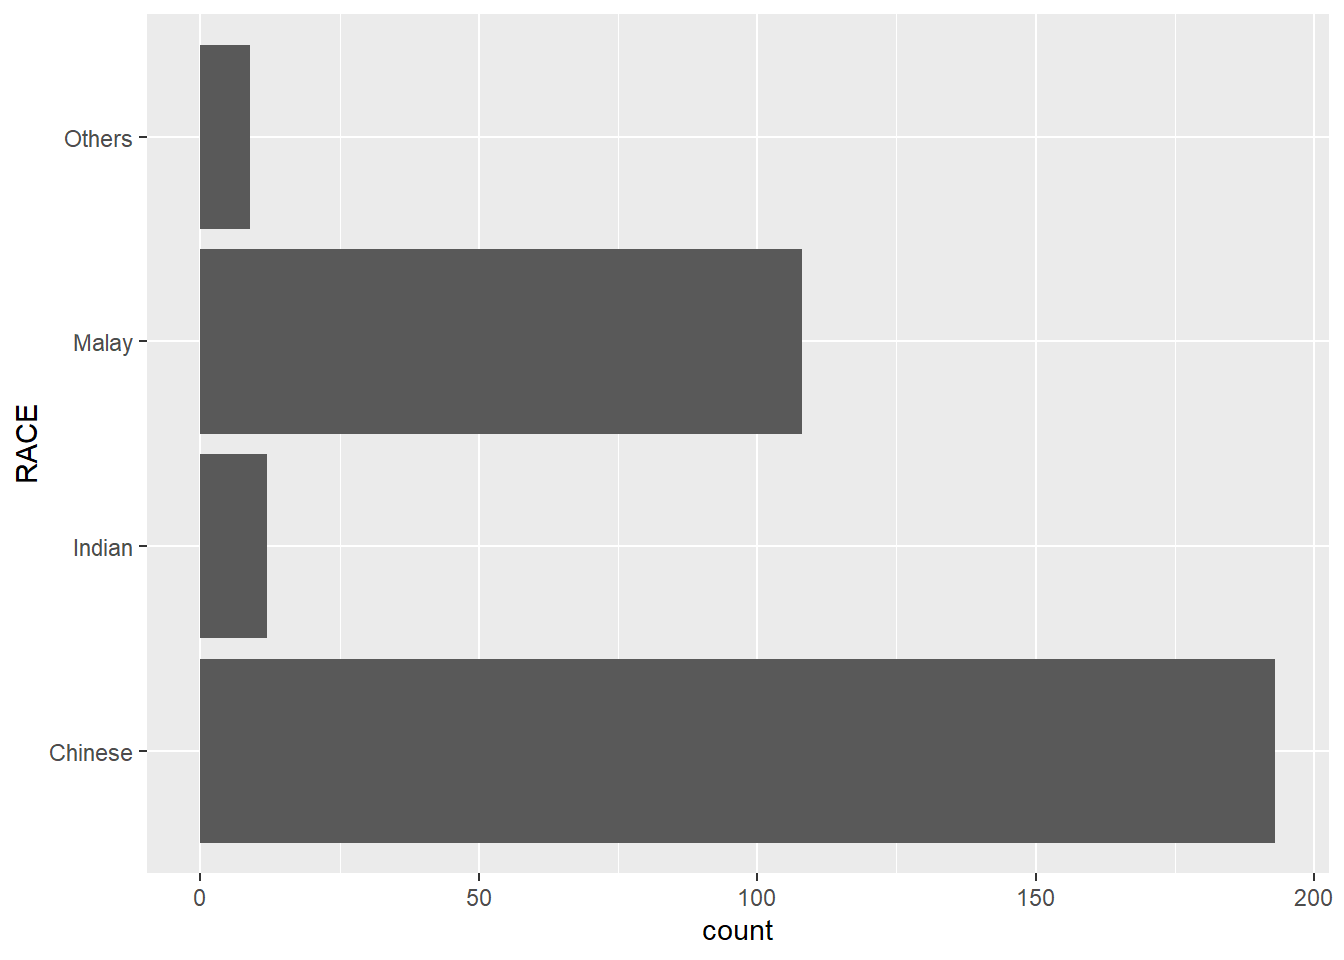
Classic Theme
ggplot(data=exam_data,
       aes(x=RACE)) +
  geom_bar() +
  coord_flip() +
  theme_classic()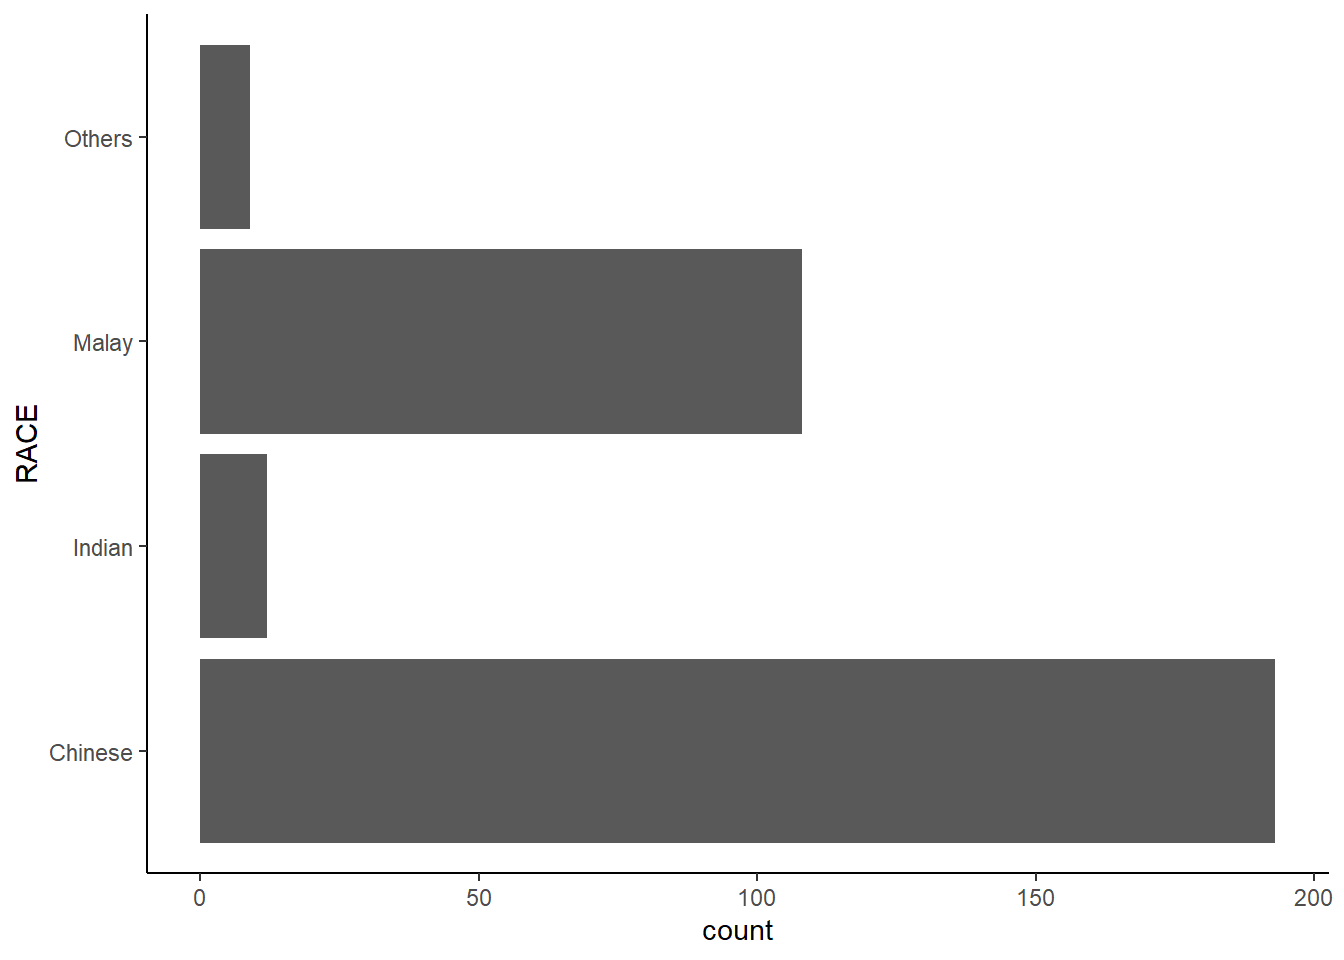
Classic Minimal
ggplot(data=exam_data,
       aes(x=RACE)) +
  geom_bar() +
  coord_flip() +
  theme_minimal()