The Task
In this take home exercise, the requirements are as of below:
Select a weather station and download historical daily temperature or rainfall data from Meteorological Service Singapore website,
Select either daily temperature or rainfall records of a month of the year 1983, 1993, 2003, 2013 and 2023 and create an analytics-driven data visualisation,
Apply appropriate interactive techniques to enhance the user experience in data discovery and/or visual story-telling.
Background
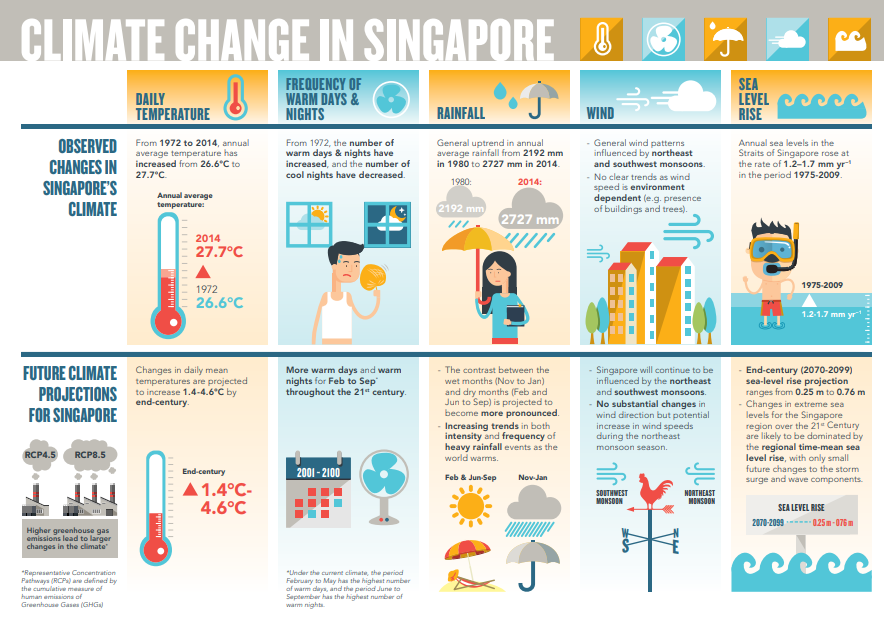
The Ministry of Sustainability and the Environment has released and infographic stating that the daily mean temperature in the coming years are projected to increase by 1.4 to 4.6, and the contrast between the wet months (November to January) and dry months (February and June to September) is likely to be more pronounced.
The Data
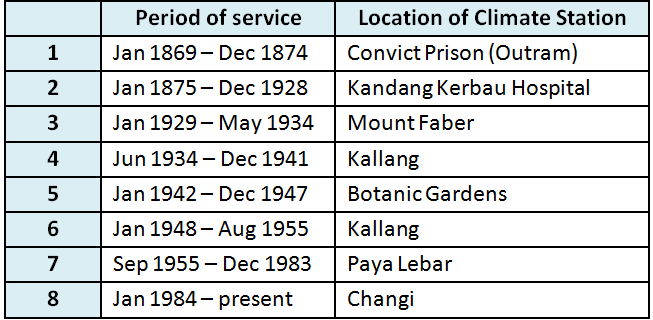
According to the World Meteorological Organisation (WMO) guidelines, a climate station monitors the climate over a long-term period to provide data that enables detection of climate change signals at a national level. The location of such stations should be located relatively far away from large urban centers and store minimally 30 years of rainfall and temperature data.
In Singapore, the climate station has been shifted several times since its inception approximately 140 years ago. The Table below shows the previous locations of where the stations used to be and is currently.
For our study, the data will be obtained from the Meteorological Service Singapore’s website. According to the infographic earlier, it was mentioned that contrast between the wet and dry months would prove to be the most pronounced in seeing changes. Therefore, the month chosen would be December for the years in focus. Additionally, the rainfall data will be used for our analysis.
Downloading of Data
The following information was used to select and download the data from the Meteorological Service Singapore’s website:
Launching R Packages
As we move through the analysis, additional packages maybe installed and run at a later time. For exploration, the following libraries will be run first:
Tidyverse
Patchwork
Plotly
Crosstalk
DT
ggdist
ggridges
ggstatsplot
ggthemes
dplyr
plyr
readr
gganimate
ggiraph
Importing and Preparing the Data for Analysis
Based on the 5 files downloaded, some pre-preparation of data had to be done before being able to input into R due to a symbol in the documents. All the dashes (-) and degree (°) symbols in the document has been replaced with the value “0” and removed respectively as the read_csv function could not parse these symbols.
The columns will later be dropped from our study as there were no records for them:
Highest 30 Min Rainfall (mm)
Highest 60 Min Rainfall (mm)
Highest 120 Min Rainfall (mm)
Mean Temperature (°C)
Maximum Temperature (°C)
Minimum Temperature (°C)
Mean Wind Speed (km/h)
Max Wind Speed (km/h)
Reading the File
# A tibble: 31 × 13
Station Year Month Day Daily Rainfall Total (mm…¹ Highest 30 Min Rainf…²
<chr> <dbl> <dbl> <dbl> <dbl> <dbl>
1 Serangoon 1983 12 1 6 0
2 Serangoon 1983 12 2 1 0
3 Serangoon 1983 12 3 3.6 0
4 Serangoon 1983 12 4 0 0
5 Serangoon 1983 12 5 0 0
6 Serangoon 1983 12 6 0 0
7 Serangoon 1983 12 7 0.3 0
8 Serangoon 1983 12 8 4.1 0
9 Serangoon 1983 12 9 56.1 0
10 Serangoon 1983 12 10 18.8 0
# ℹ 21 more rows
# ℹ abbreviated names: ¹`Daily Rainfall Total (mm)`,
# ²`Highest 30 Min Rainfall (mm)`
# ℹ 7 more variables: `Highest 60 Min Rainfall (mm)` <dbl>,
# `Highest 120 Min Rainfall (mm)` <dbl>, `Mean Temperature (C)` <dbl>,
# `Maximum Temperature (C)` <dbl>, `Minimum Temperature (C)` <dbl>,
# `Mean Wind Speed (km/h)` <dbl>, `Max Wind Speed (km/h)` <dbl>
# A tibble: 31 × 13
Station Year Month Day Daily Rainfall Total (mm…¹ Highest 30 Min Rainf…²
<chr> <dbl> <dbl> <dbl> <dbl> <dbl>
1 Serangoon 1993 12 1 50.5 0
2 Serangoon 1993 12 2 4.2 0
3 Serangoon 1993 12 3 28 0
4 Serangoon 1993 12 4 1.2 0
5 Serangoon 1993 12 5 33.8 0
6 Serangoon 1993 12 6 8.5 0
7 Serangoon 1993 12 7 0 0
8 Serangoon 1993 12 8 20.9 0
9 Serangoon 1993 12 9 0 0
10 Serangoon 1993 12 10 12.5 0
# ℹ 21 more rows
# ℹ abbreviated names: ¹`Daily Rainfall Total (mm)`,
# ²`Highest 30 Min Rainfall (mm)`
# ℹ 7 more variables: `Highest 60 Min Rainfall (mm)` <dbl>,
# `Highest 120 Min Rainfall (mm)` <dbl>, `Mean Temperature (C)` <dbl>,
# `Maximum Temperature (C)` <dbl>, `Minimum Temperature (C)` <dbl>,
# `Mean Wind Speed (km/h)` <dbl>, `Max Wind Speed (km/h)` <dbl>
# A tibble: 31 × 13
Station Year Month Day Daily Rainfall Total (mm…¹ Highest 30 Min Rainf…²
<chr> <dbl> <dbl> <dbl> <dbl> <dbl>
1 Serangoon 2003 12 1 0.6 0
2 Serangoon 2003 12 2 6 0
3 Serangoon 2003 12 3 0 0
4 Serangoon 2003 12 4 0 0
5 Serangoon 2003 12 5 5.5 0
6 Serangoon 2003 12 6 0.4 0
7 Serangoon 2003 12 7 0.2 0
8 Serangoon 2003 12 8 0.2 0
9 Serangoon 2003 12 9 24.3 0
10 Serangoon 2003 12 10 12.7 0
# ℹ 21 more rows
# ℹ abbreviated names: ¹`Daily Rainfall Total (mm)`,
# ²`Highest 30 Min Rainfall (mm)`
# ℹ 7 more variables: `Highest 60 Min Rainfall (mm)` <dbl>,
# `Highest 120 Min Rainfall (mm)` <dbl>, `Mean Temperature (C)` <dbl>,
# `Maximum Temperature (C)` <dbl>, `Minimum Temperature (C)` <dbl>,
# `Mean Wind Speed (km/h)` <dbl>, `Max Wind Speed (km/h)` <dbl>
# A tibble: 31 × 13
Station Year Month Day Daily Rainfall Total (mm…¹ Highest 30 Min Rainf…²
<chr> <dbl> <dbl> <dbl> <dbl> <dbl>
1 Serangoon 2013 12 1 20 0
2 Serangoon 2013 12 2 8.6 0
3 Serangoon 2013 12 3 92.9 0
4 Serangoon 2013 12 4 0.2 0
5 Serangoon 2013 12 5 23 0
6 Serangoon 2013 12 6 59.2 0
7 Serangoon 2013 12 7 0 0
8 Serangoon 2013 12 8 25.2 0
9 Serangoon 2013 12 9 0 0
10 Serangoon 2013 12 10 0 0
# ℹ 21 more rows
# ℹ abbreviated names: ¹`Daily Rainfall Total (mm)`,
# ²`Highest 30 Min Rainfall (mm)`
# ℹ 7 more variables: `Highest 60 Min Rainfall (mm)` <dbl>,
# `Highest 120 Min Rainfall (mm)` <dbl>, `Mean Temperature (C)` <dbl>,
# `Maximum Temperature (C)` <dbl>, `Minimum Temperature (C)` <dbl>,
# `Mean Wind Speed (km/h)` <dbl>, `Max Wind Speed (km/h)` <dbl>
# A tibble: 31 × 13
Station Year Month Day Daily Rainfall Total (mm…¹ Highest 30 min Rainf…²
<chr> <dbl> <dbl> <dbl> <dbl> <dbl>
1 Serangoon 2023 12 1 16.4 3
2 Serangoon 2023 12 2 0 0
3 Serangoon 2023 12 3 0 0
4 Serangoon 2023 12 4 0 0
5 Serangoon 2023 12 5 0 0
6 Serangoon 2023 12 6 0 0
7 Serangoon 2023 12 7 0 0
8 Serangoon 2023 12 8 0 0
9 Serangoon 2023 12 9 0 0
10 Serangoon 2023 12 10 0 0
# ℹ 21 more rows
# ℹ abbreviated names: ¹`Daily Rainfall Total (mm)`,
# ²`Highest 30 min Rainfall (mm)`
# ℹ 7 more variables: `Highest 60 min Rainfall (mm)` <dbl>,
# `Highest 120 min Rainfall (mm)` <dbl>, `Mean Temperature (C)` <dbl>,
# `Maximum Temperature (C)` <dbl>, `Minimum Temperature (C)` <dbl>,
# `Mean Wind Speed (km/h)` <dbl>, `Max Wind Speed (km/h)` <dbl>
Combining the Files
# A tibble: 165 × 606
Station Year Month Day Daily Rainfall Total (mm…¹ Highest 30 Min Rainf…²
<chr> <dbl> <dbl> <dbl> <dbl> <dbl>
1 Serangoon 1983 12 1 6 0
2 Serangoon 1983 12 2 1 0
3 Serangoon 1983 12 3 3.6 0
4 Serangoon 1983 12 4 0 0
5 Serangoon 1983 12 5 0 0
6 Serangoon 1983 12 6 0 0
7 Serangoon 1983 12 7 0.3 0
8 Serangoon 1983 12 8 4.1 0
9 Serangoon 1983 12 9 56.1 0
10 Serangoon 1983 12 10 18.8 0
# ℹ 155 more rows
# ℹ abbreviated names: ¹`Daily Rainfall Total (mm)`,
# ²`Highest 30 Min Rainfall (mm)`
# ℹ 600 more variables: `Highest 60 Min Rainfall (mm)` <dbl>,
# `Highest 120 Min Rainfall (mm)` <dbl>, `Mean Temperature (C)` <dbl>,
# `Maximum Temperature (C)` <dbl>, `Minimum Temperature (C)` <dbl>,
# `Mean Wind Speed (km/h)` <dbl>, `Max Wind Speed (km/h)` <dbl>, …
Selecting the Columns to Keep
tibble [165 × 3] (S3: tbl_df/tbl/data.frame)
 $ Year                     : Factor w/ 5 levels "1983","1993",..: 1 1 1 1 1 1 1 1 1 1 ...
 $ Day                      : num [1:165] 1 2 3 4 5 6 7 8 9 10 ...
 $ Daily Rainfall Total (mm): num [1:165] 6 1 3.6 0 0 0 0.3 4.1 56.1 18.8 ...
Next, we will inspect the new data table for any duplicates and checking that the columns have been correctly selected.
# A tibble: 9 × 3
  Year    Day `Daily Rainfall Total (mm)`
  <fct> <dbl>                       <dbl>
1 <NA>     NA                          NA
2 <NA>     NA                          NA
3 <NA>     NA                          NA
4 <NA>     NA                          NA
5 <NA>     NA                          NA
6 <NA>     NA                          NA
7 <NA>     NA                          NA
8 <NA>     NA                          NA
9 <NA>     NA                          NA
Visualizing the Data
Since we inspected and confirmed that the data has no duplicate and all values are provided, we will explore the data that we have through various visualizations to understand the data better.
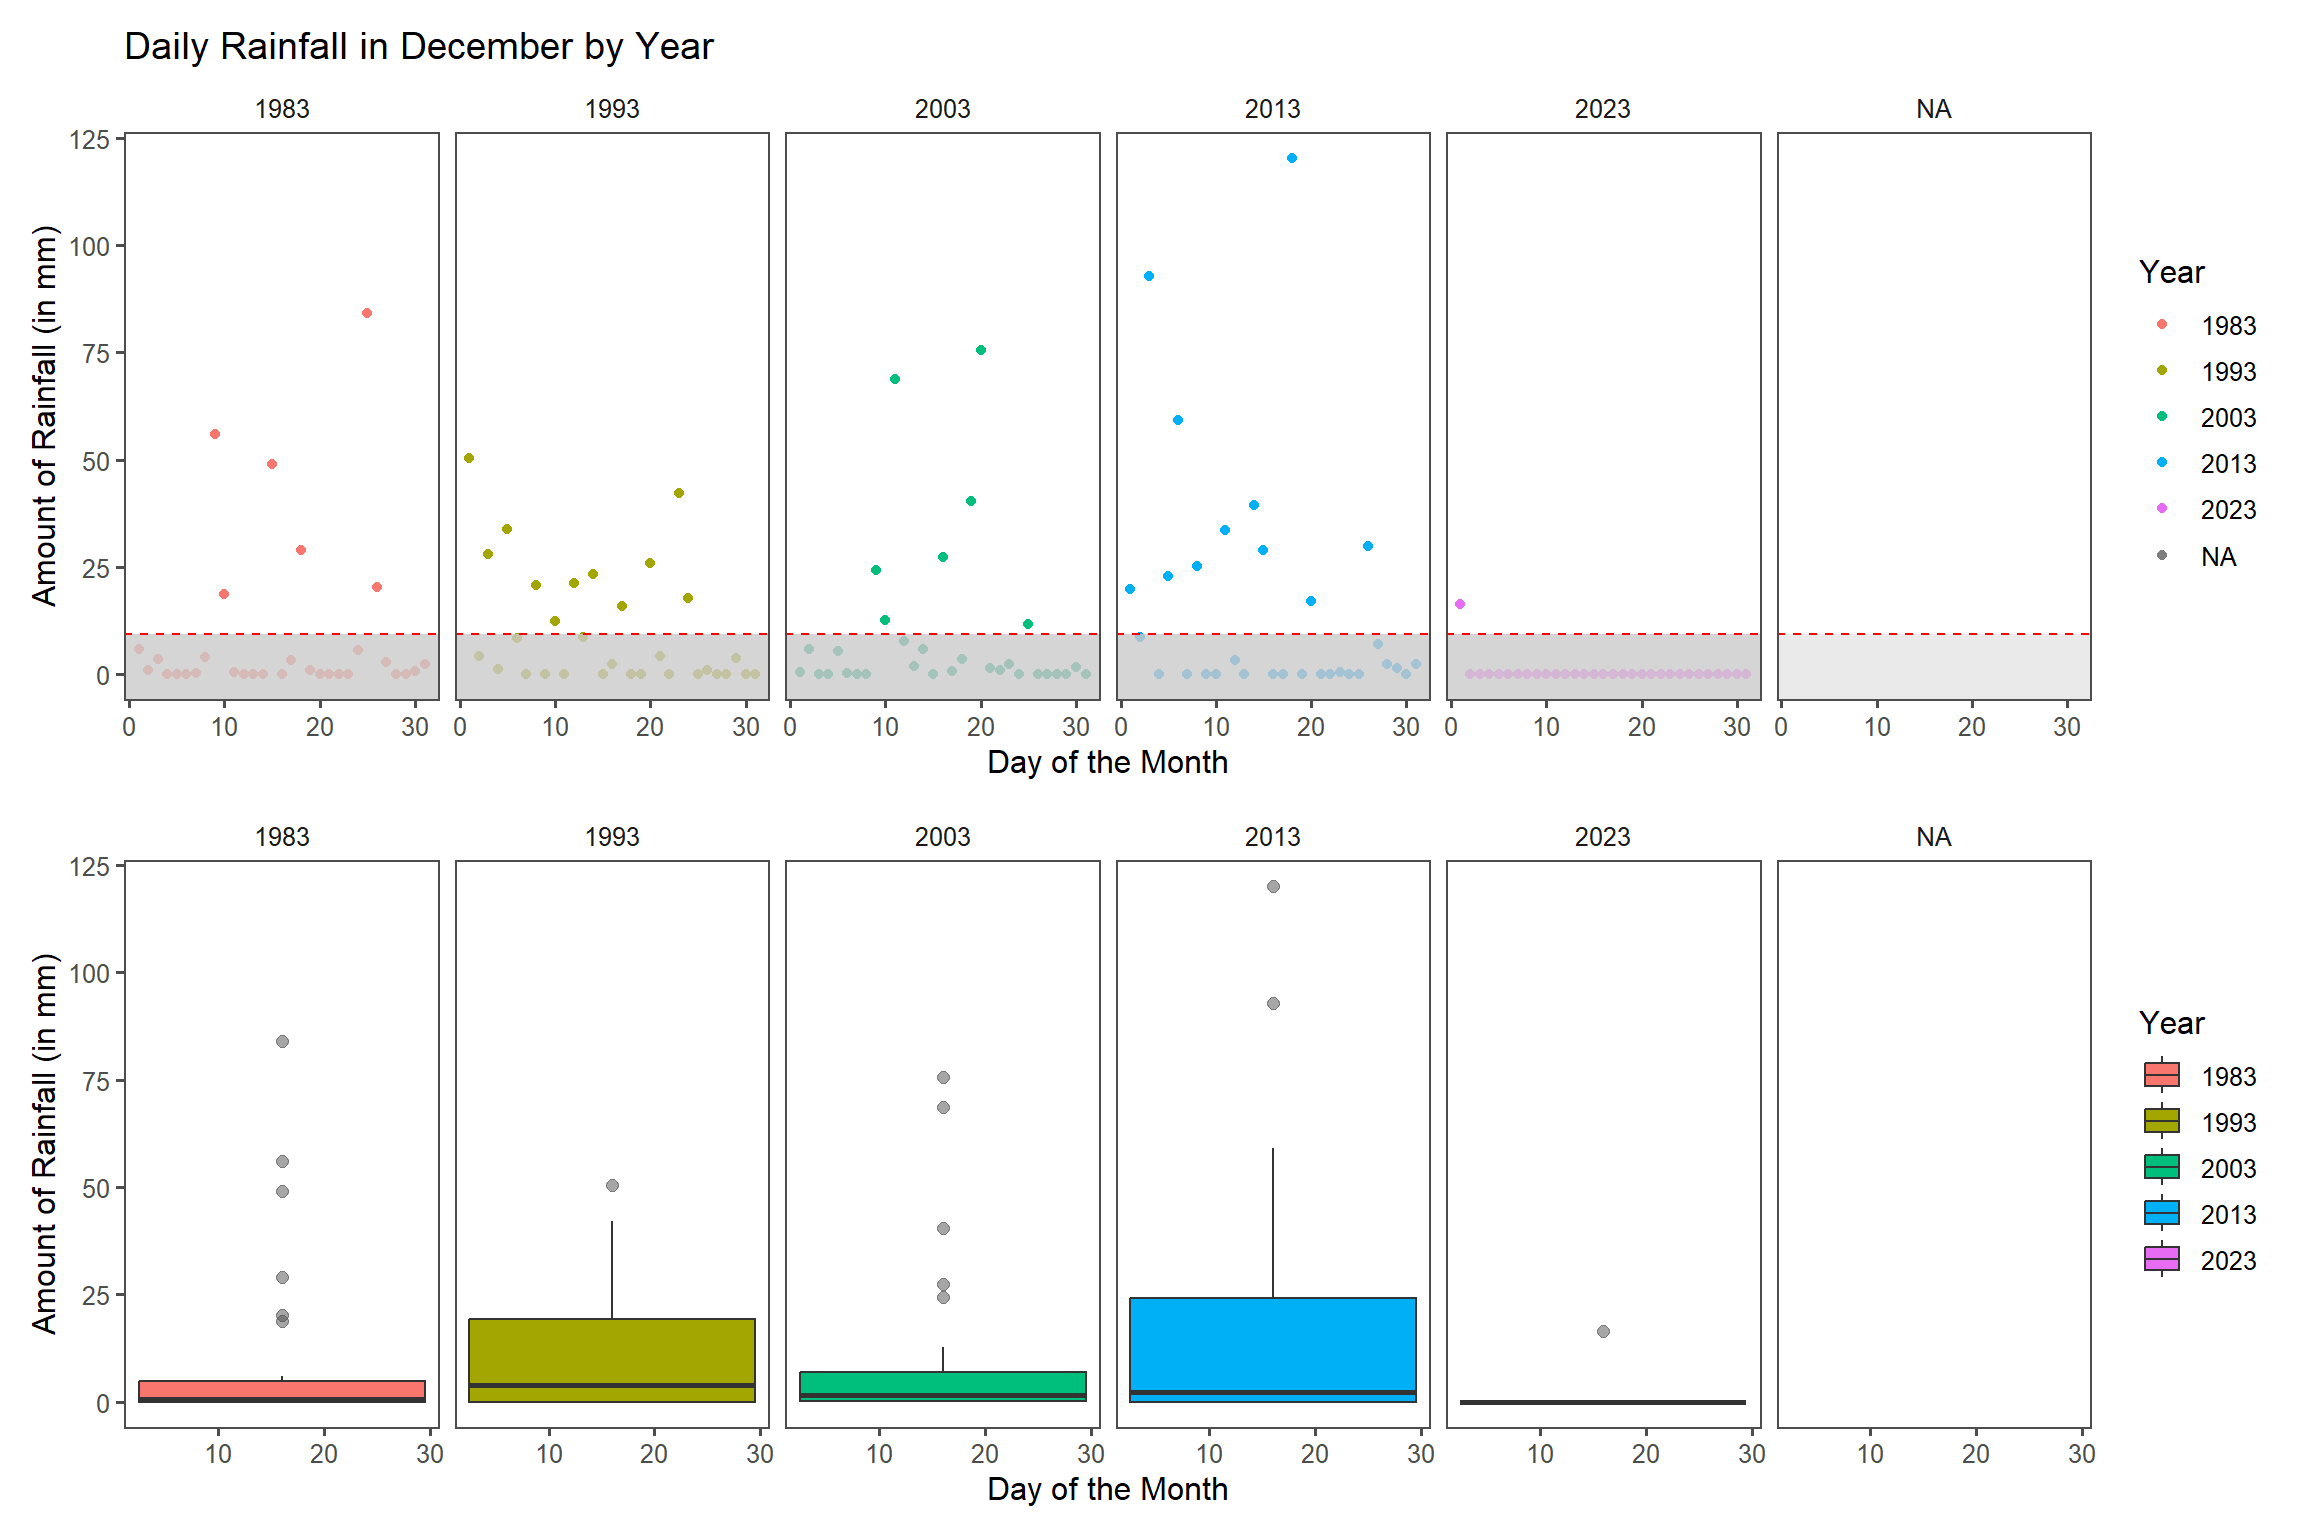
Daily Rainfall in December By Year
Based on the charts above, the frequency of rainfall above the total average across 5 years seem to be increasing with the exception of year 2023. For year 2023, it is significantly different from the previous selected years as there was only 1 incident of rainfall throughout the entire month.
As the year is an outlier, we will not take into account 2023’s year into our comparison and analysis.
Another observation from the above charts is that even though the frequency of rainfall above the total average is increasing, the mean of rainfall across each individual year do not seem to be very much different.
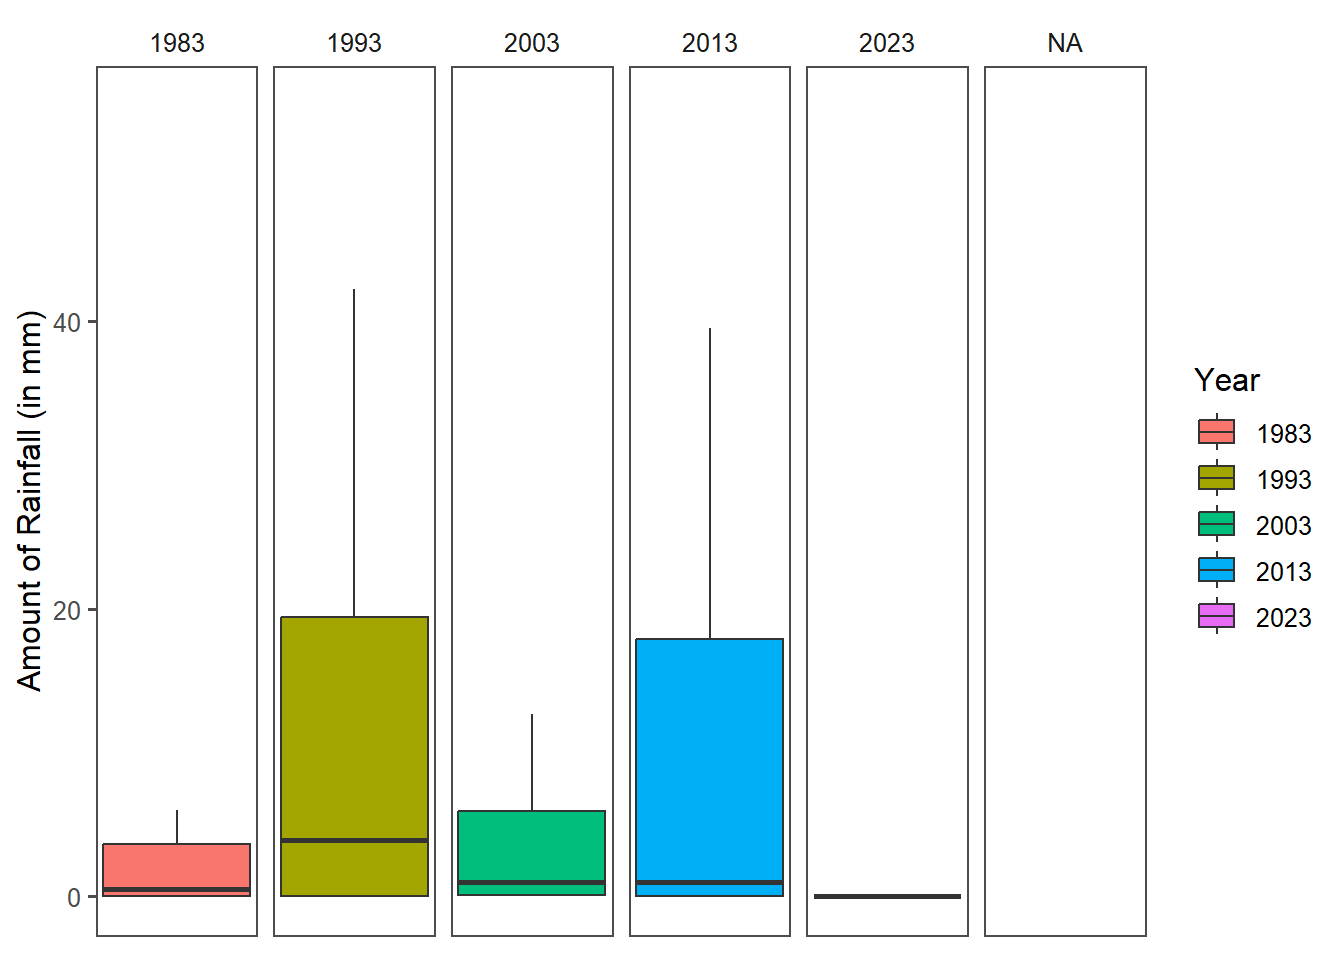
The above chart is a representation of the earlier chart with the outliers removed to have a clearer look at the average of rainfall for each year. Even though there was an increase in frequency of higher than average rainfall, the year-by-year comparison does not show any significant increase as what the infographic mentions.
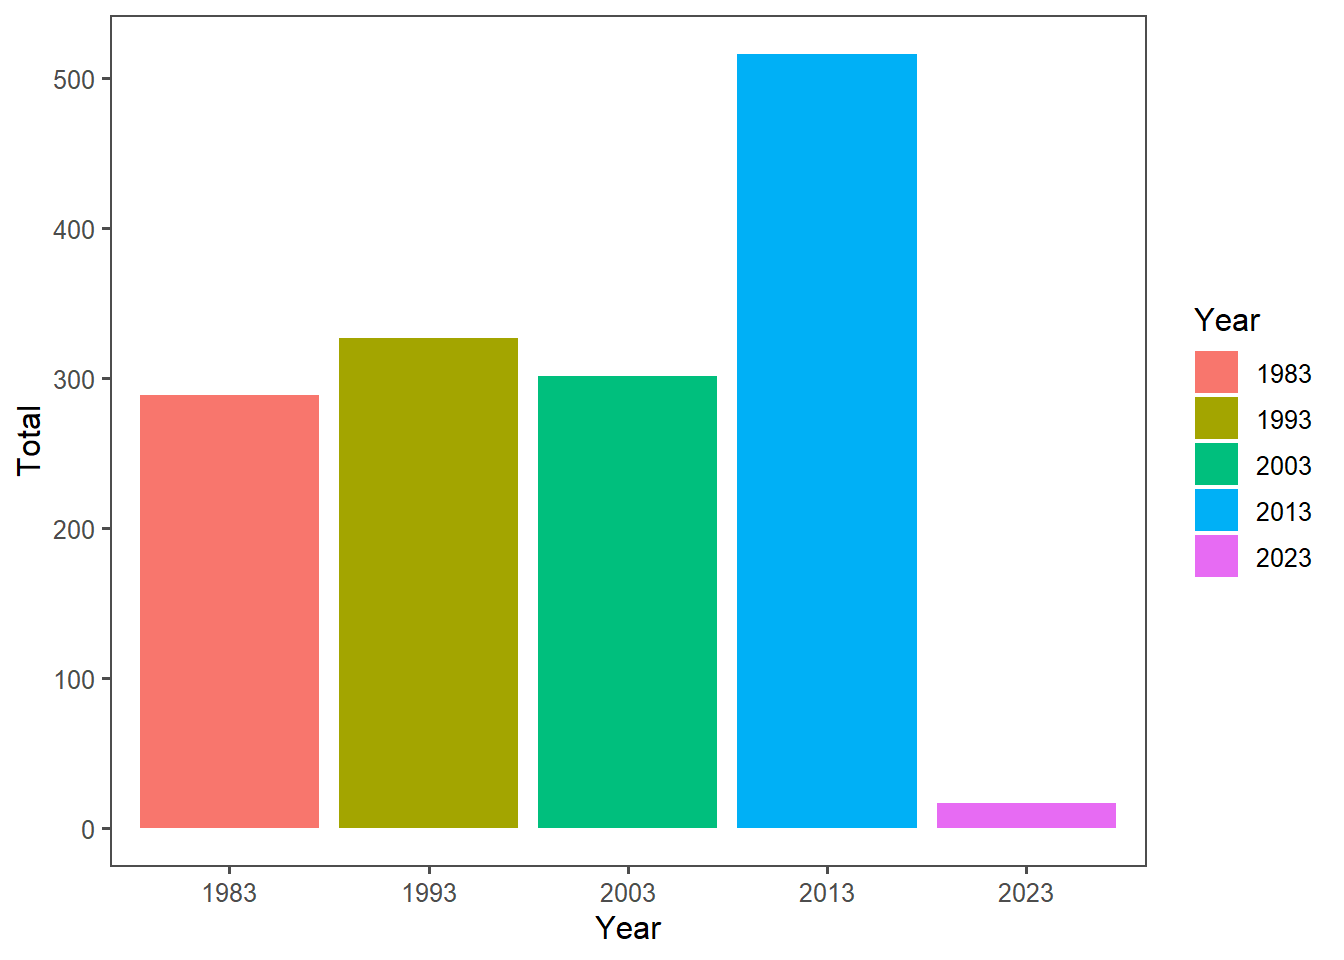
However, according to the bar chart below, there was an increase in total rainfall for the month of December across the years.
  Group.1     x
1    1983 288.9
2    1993 326.9
3    2003 301.1
4    2013 516.0
5    2023  16.4
  Group.1          x
1    1983  9.3193548
2    1993 10.5451613
3    2003  9.7129032
4    2013 16.6451613
5    2023  0.5290323
'data.frame':   5 obs. of  3 variables:
 $ Year : num  1983 1993 2003 2013 2023
 $ Mean : num  9.32 10.55 9.71 16.65 0.53
 $ Total: num  288.9 326.9 301.1 516 16.4
Interactive Visualization
Based on the first chart, the next 2 charts will be an interactive version of it. One to show the changes across time and another that can provide selection of information in the hopes of enhancing the analysis.
Interactive Chart 1
The interactive chart below is meant to show various rainfall across the years, however due to an error in R, the column “Year” (factor) is currently not being recognized correctly. This has proved to be of much hindrance for this study and interactivity.
Additional Interactivity and Other EDA of Data
Back to top